Integrato Financial Services Est. 2017  ·  Greater Noida West
AMFI MFD  ·  IRDAI Licensed  ·  NISM Certified
Integrato Times
India's Premier AI-Powered Financial Newspaper   Published Every Sunday
VOL. I  ·  EDITION #001
EDITION #001 VOLUME I  ·  ESTABLISHED MAY 2026-27 PRICE: FREE  |  PREMIUM MEMBERSHIP AVAILABLE
🔴 Live News
Loading Fetching latest headlines from ET, Moneycontrol, Business Standard, Livemint, RBI...
BSE Sensex
—
Live
vs prev close · 1D
NSE Nifty 50
—
Live
vs prev close · 1D
Bank Nifty
—
Live
vs prev close · 1D
Gold (₹/10g)
—
Live
vs prev close · 1D
USD / INR
—
Live
Crude Oil ($/bbl)
—
Live
FII Net (Week)
−₹5,740 Cr
This week · YTD: −₹2,06,180 Cr
DII Net (Week)
+₹441 Cr
YTD: +₹3,10,067 Cr
SIP Flows (Apr)
₹25,926 Cr
Record · 45th consecutive
10Y G-Sec Yield
6.93%
▼ from 7.02% last week
Repo Rate (RBI)
5.25%
Cut from 6.00% (1Y ago)
CPI Inflation
3.40%
Mar 2026 · Below 4% target
GDP Growth
7.80%
Q3 FY27 · Robust
Nifty P/E
21.16×
Fair · 5Y avg 23×
Live prices via Yahoo Finance  ·  % = 1-day change vs prev close · Macro: RBI / SEBI / AMFI Fetching live data...
Front Page
Edition Date
Market Mood · Live
📊
Recovering
Score: 50/100
How is this calculated? ℹ
⚡ This Week That Matters
▶ Nifty at 23,413 — snapped 4-day losing streak; Metal, FMCG, Energy led recovery
▶ India hikes gold & silver import tariff to 15% — prices may ease; review gold allocation
▶ Nifty Metal Index surged 3.18% May 13 — best sector of the week; energy stocks up too
▶ Sensex swung 1,000 pts intraday (74,134 low to 75,191 high) — high volatility, stay disciplined
▶ West Asia tensions (Iran) pushing crude up — OMCs under pressure; watch energy sector
▶ IT sector leading; review tech fund allocation

Loading this week's top story...


Sensex swings 1,000 pts in a single session — India hikes gold tariffs, Metal stocks surge 3%, crude oil under West Asia pressure. Here is what every Indian investor must know this week.. Please check back on Sunday morning.

India's economic engine is running hot. The Manufacturing PMI for April 2026 surged to 59.1 — the highest reading in over a decade — signalling broad-based expansion across output, new orders, and employment. Sugar production, agricultural commodity exports, and rural consumption are all firing simultaneously, painting a picture that senior economists are calling "a structural inflection point."

For the long-term investor, this is not noise. This is signal. When an economy of India's complexity synchronises its manufacturing and consumption engines, the equity markets tend to respond over quarters, not weeks. The current PMI reading, sustained over three consecutive months, suggests that corporate earnings upgrades — particularly in FMCG, industrials, and infrastructure — are a matter of when, not if.

The critical question for investors this week: Are your portfolio allocations positioned to capture this structural shift? Or are you still overweight in defensive sectors that underperform in expansionary cycles?
✦ AI Investor Insight

PMI above 55 has historically preceded Nifty outperformance by 15-25% over the following 12 months. This is a medium-term bullish signal — not a reason to time the market, but strong confirmation to stay fully invested in equity.

"The disciplined investor who stays the course will always outperform the anxious investor who tries to time the market. India's growth story is intact — the only variable is your patience."

— SANJEEV SHARMA, FOUNDER & CEO, INTEGRATO FINANCIAL SERVICES

Market Snapshot

Sensex——
Nifty 50——
Nifty Bank——
Gold——
USD/INR——
Crude Oil——

Data updated weekly. Live prices via market API.

Sensex — Weekly Performance

In Brief

RECOVERY
Sensex snaps 4-day losing streak, closes at 74,609 — Metal & FMCG lead recovery
Sensex swung 1,000+ pts intraday on May 13 (low 74,134, high 75,191). West Asia crude pressure and FII selling are the headwinds. Metal stocks (+3.18%) and FMCG led the recovery. What to do: Do not exit SIPs — corrections are when SIPs accumulate at lower NAV.
POLICY
RBI cuts repo rate to 5.25% — Home loan EMIs to fall ₹700–1,200/month
Second consecutive cut signals a clear easing cycle. Action: Review floating rate loans. Add short-duration debt funds to your portfolio now.
POLICY
India hikes gold & silver import tariff to 15% — PM Modi calls for reduced fuel usage
Govt doubles gold tariff (6%→15%) to protect forex reserves amid rupee pressure. West Asia tensions keep crude elevated. Impact: Gold prices may ease short-term; review gold ETF allocation. FII selling (−₹5,740 Cr this week) continues.
DATA
April SIP: ₹25,926 Cr — 45th straight record; 10.7 crore active SIP accounts
Even during this week's 1,456-pt crash, SIP inflows held firm — retail India has matured. Sensex 52-wk high: 86,159 · Current: 74,609 · A 12% discount from peak. Source: AMFI.

₹25,926 Crore in April SIPs — India's 45th Consecutive Month of Record Growth


April 2026 SIP data should be pinned on every investor's wall. ₹25,926 crore — the 45th consecutive month of record growth. This week, Sensex swung over 1,000 points intraday as West Asia tensions pushed crude higher and FIIs continued selling. Through all of it, SIP flows held. Sensex is 12% below its 86,159 peak at 74,609 — disciplined SIP investors are buying at a discount.

Flexi-cap and large-cap funds continue to attract the highest share. For new investors: start a SIP today, increase it 10% each April, and do not check NAVs more than once a month.

What to do: Review your SIP allocation. If equity is below 70% of your portfolio and your horizon is 7+ years, consider increasing it.

Your Nominees Are Wrong — The Most Expensive Financial Mistake Indian Families Make


IRDAI data reveals that 23% of life insurance claims face delays or rejections due to incorrect or outdated nominee information. The average delayed claim takes 14 months to resolve — during which families face financial stress at their most vulnerable moment.

The fix takes 15 minutes: log in to your insurance portal, mutual fund platform, and bank, and verify every nominee name, date of birth, and relationship. Do this once a year — make it a January ritual.

Action this week: Check nominees on: Life insurance, Health insurance, EPF, Mutual funds, Bank FDs, Demat account.

Old vs New Tax Regime FY2026-27: The Definitive Break-Even Analysis


If your gross income is below ₹7.75 lakh: New regime — no tax due to rebate. If your income is ₹10-15 lakh with HRA + 80C + NPS: Old regime saves ₹15,000-40,000 annually. Above ₹15 lakh with no HRA: New regime is almost always better.

The critical variable most miss: the new regime forces you to invest without the 80C crutch — which for disciplined investors can actually be wealth-positive. Consult your advisor before switching for FY27.

Key deadline: Inform your employer of regime choice before May 31st to adjust TDS for FY2026-27.

📈 Market Pulse

NSE Sectoral Heatmap — All Official Indices

23 Sectors  ·  Week of 13 May 2026  ·  Source: NSE India
Outperforming (Green) Underperforming (Red) Deeper color = stronger move
Nifty 50 — Week (Mon–Fri)

"Volatility is not the enemy. Reacting to volatility without a plan — that is the enemy."

— Sanjeev Sharma

Sector Performance — % Change
Top Gainers This Week
FII vs DII Net Buy (₹ Crore)
Top Losers This Week

✍️ From the Desk of Sanjeev Sharma
Founder & MD/CEO · Integrato Financial Services · 25+ Years Experience
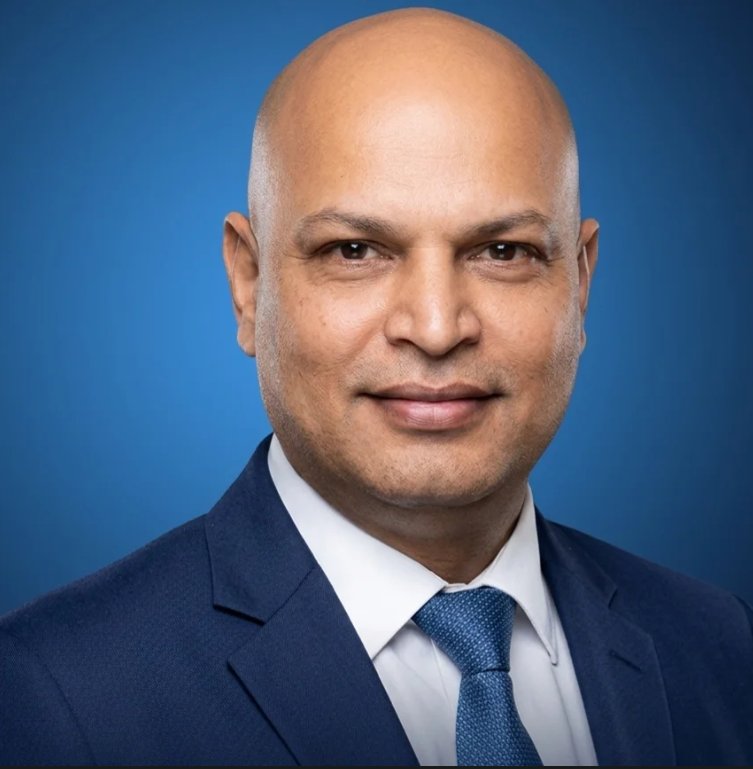
Sanjeev Sharma

Sanjeev Sharma

Founder & MD/CEO · Integrato Financial Services Private Limited

AMFI Registered MFD · IRDAI Licensed · NISM Certified · 25+ Years Experience

The Patient Investor's Advantage: Why Time in Market Beats Timing the Market


Twenty-five years of watching markets move teaches you one fundamental truth: the investors who build lasting wealth are rarely the most intelligent in the room. They are the most patient.

This week, as we witnessed another bout of short-term volatility that sent many investors scrambling for the exit — only to see markets recover within days — I found myself returning to this core belief. Patience is not a passive strategy. It is, in fact, the most sophisticated investment approach available to any individual investor.

Consider the mathematics. If you invested ₹10,000 per month via SIP in a diversified equity mutual fund starting January 2015, your total investment of ₹12 lakh over 10 years would have grown to approximately ₹28-32 lakh — a return that no fixed deposit, no short-term trader, and no market timer could have delivered consistently.

The Sensex has fallen more than 20% on seven occasions in the past 25 years. Each time, the recovery has been complete — and then some. Each correction is a buying opportunity for the long-term investor, not a catastrophe.

My advice this week is simple: review your financial goals, not your portfolio performance. Your goals have not changed. Your investment horizon has not shortened. If you are investing for retirement 15 years away, a 5% correction this week is irrelevant to your outcome. What is relevant is whether you continued your SIP. Whether you stayed the course.

Wealth creation is not an event. It is a process — a disciplined, boring, consistent process that rewards those who respect it.

"Wealth creation is not an event. It is a process — a disciplined, boring, consistent process that rewards those who respect it."

— Sanjeev Sharma, Integrato Financial

The data supports this philosophy conclusively. A SEBI study of retail investors found that those who stayed invested through the COVID-19 crash of March 2020 and continued their SIPs saw their portfolios grow by 140-180% by December 2024. Those who paused or redeemed during the crash captured only 60-80% of that recovery.

What separates the successful investor is not intelligence — it is behavioural discipline. And that discipline is built through financial planning, not market watching.

At Integrato Financial, we have guided over 1,500 families through three major market downturns — 2008, 2020, and the brief correction of 2022. Not one family that stayed invested with a well-structured portfolio has been worse off for it. Not one.

This week, take one action: call your financial advisor and review your asset allocation. Not your returns. Your allocation. Are you still on track for your goals? If yes — relax. If no — adjust calmly and systematically.

The market will continue to fluctuate. Your wealth creation plan should not.

Sanjeev Sharma
Founder, MD & CEO, Integrato Financial Services · Greater Noida West

💰 Mutual Funds
Top Performing Funds — 1 Year

Quant Small Cap Fund+48.2%
Nippon India Small Cap+41.5%
Parag Parikh Flexi Cap+38.3%
HDFC Flexi Cap Fund+35.7%
Axis Midcap Fund+32.9%
SIP Collections — Monthly (₹ Crore)

SEBI's New MF Regulations 2026: Lower TER, Life Cycle Funds & What Changes for Your SIP


SEBI's December 2025 Mutual Fund Regulations 2026 — effective from January 2026 — bring the most significant overhaul of MF rules since 1996. SEBI now separates TER into Base Expense Ratio + actual taxes (GST, STT). Brokerage cap cut from 12 bps to 6 bps. New 'Life Cycle Funds' introduced. Here is what invest across large, mid, and small-cap stocks based on market conditions — making them ideal for investors who want a single, well-managed equity exposure.
🔍 What No One Tells You About Mutual Funds
The "Exit Load" Trap
Most equity funds charge 1% exit load if you redeem within 1 year. On ₹10 lakh, that's ₹10,000 gone immediately. Always check exit load before switching funds emotionally after a correction.
Direct vs Regular — The 0.5% Gap
Direct plans cost 0.5–1% less in expense ratio vs regular plans. On ₹50 lakh corpus, this adds up to ₹3–5 lakh extra over 10 years. But direct plans have no advisor support. Choose based on your knowledge level.
IDCW vs Growth — Which Is Better?
IDCW (dividend) plans pay out returns periodically, but each payout is taxable at your slab rate. Growth plans compound without tax until you redeem. For wealth creation: Growth plan is almost always better.
Source: AMFI / SEBI Regulations 2024–2025 · For educational purposes. Consult your financial advisor for personal advice.

👨‍👩‍👧 Personal Finance

Section 80C: Maximising the ₹1.5 Lakh Deduction in FY 2026-27


With the new financial year underway, investors in the old tax regime have an opportunity to plan their Section 80C investments systematically rather than in a last-minute rush. The most tax-efficient options remain ELSS mutual funds (3-year lock-in) and PPF (long-term).

ELSS funds offer the dual benefit of tax saving and equity market returns — making them the preferred choice for investors with a 5+ year horizon.

NPS Tier I vs Tier II: Understanding the Difference Before You Invest


The National Pension System offers two account types with significantly different withdrawal rules and tax treatment. Tier I accounts — mandatory for NPS subscribers — offer additional tax benefits of up to ₹50,000 under Section 80CCD(1B) but restrict withdrawals until age 60.

Tier II accounts, while more flexible, do not carry the same tax benefits, making them essentially a regular investment account.

Start of Financial Year — Action Items

✓ Renew/review all insurance policies
✓ Verify nominees across all investments
✓ Increase SIP by 10-15% (Step-up)
✓ File Form 15G/H if applicable
✓ Review and rebalance portfolio
✓ Update KYC across all folios
✓ Check TDS deduction status
✓ Plan 80C investments early
🛡️ Insurance Intelligence

IRDAI Mandates 30-Day Claim Settlement Across All Life Insurers


The Insurance Regulatory and Development Authority of India has issued revised claim settlement guidelines requiring life insurers to settle all death claims within 30 days of receiving complete documentation. The move is expected to significantly benefit policyholders and nominees across India.

Insurers failing to comply will face monetary penalties and public disclosure of their claim settlement ratios, creating strong market-based accountability.

Will-Writing Made Simple: How Every Indian Family Can Secure Their Estate


Health insurance premiums across major insurers have risen 15-20% this year, driven by rising medical inflation and increased claims post-pandemic. Financial planners are advising clients to secure coverage at younger ages to lock in lower premiums.

Family floater plans with ₹10-25 lakh coverage are being recommended as the minimum adequate protection for Indian families in 2026.

Essential Coverage Every Family Needs

✓ Term Life: 10-15x annual income
✓ Health: ₹10L+ family floater
✓ Critical Illness rider added
✓ Personal Accident cover
✓ Nominees updated annually
✓ Policy documents in FamilyVault
✦ Portfolio Review Session — from ₹2,999
Talk to Sanjeev Sharma — 25+ Years. All financial decisions.
Whether it is your SIP portfolio, insurance coverage, tax planning, retirement corpus, or estate planning — get an expert second opinion. AMFI MFD · IRDAI Licensed · NISM Certified · NSE Certified Financial Goal Planner.
💰 MF Portfolio
Review
🛡️ Insurance
Adequacy Check
🎯 Retirement
Planning
📋 Tax Planning
FY 2026-27
📈 SIP Strategy
Optimise Returns
📱 WhatsApp Now
+91 95991 81681
Free · No obligation · Greater Noida West · hello@integrato.in

🏛️ RBI & Policy

RBI Cuts Repo Rate to 5.25% — Second Consecutive Cut; EMIs to Fall


The Reserve Bank of India's Monetary Policy Committee maintained the repo rate at 5.25% in its latest meeting, signalling continued support for economic growth while monitoring inflation closely. The decision was unanimous, reflecting confidence in the current monetary policy stance.

Bond markets reacted positively, with the 10-year government security yield easing marginally. Analysts expect the accommodative stance to continue through the current fiscal year.

SEBI Tightens F&O Rules; Retail Investor Protection Enhanced


The Securities and Exchange Board of India has implemented stricter eligibility criteria for retail participation in futures and options trading, requiring minimum net worth declarations and mandatory risk disclosure acknowledgements.

The move follows data showing that 90% of retail F&O traders incur losses, and aims to redirect retail investors toward more suitable wealth-creation instruments like mutual funds and SIPs.

Budget 2026 Impact: Key Changes for Individual Investors


Union Budget 2026 introduced several investor-friendly measures including enhanced LTCG exemption limits for equity mutual funds and revised tax slabs under the new regime. Financial advisors are recommending a comprehensive review of investment strategies to align with the new tax framework before the end of Q1 FY27.


📊 Stocks & Analysis

IT Sector Leads Rally on Strong Quarterly Earnings and Dollar Strength


India's IT sector emerged as the top performer this week with TCS, Infosys, HCL Technologies and Wipro posting strong quarterly results backed by deal wins and operational efficiency improvements. A stronger US dollar also boosted earnings for these export-heavy companies.

Analysts are maintaining 'overweight' ratings on large-cap IT stocks, citing resilient demand from BFSI and healthcare verticals in the US and Europe.

IPO Pipeline Remains Strong; ₹80,000 Crore in Issues Expected This Quarter


The Indian primary market continues to attract investor interest with a strong pipeline of IPOs across technology, manufacturing, and financial services sectors. Market analysts expect over ₹80,000 crore in primary market issuances this quarter.

Retail investors are advised to evaluate IPO fundamentals carefully rather than applying based solely on grey market premium, which has proven unreliable as a predictor of listing performance.

Stock Market Principles

✓ Never invest borrowed money
✓ Diversify across 15-20 stocks
✓ Review quarterly, not daily
✓ SIP beats lump-sum timing
✓ Fundamentals over tips
✓ Keep 5-7 year time horizon

🌍 Global Economy

Fed Signals Cautious Rate Path; Dollar Strengthens Against Emerging Currencies


The US Federal Reserve maintained its benchmark rate while signalling a cautious approach to future cuts, citing persistent service sector inflation. The dollar index strengthened on the back of this guidance, creating some headwinds for emerging market currencies including the Indian Rupee.

For Indian investors with US equity exposure through international mutual funds, the currency movement provided an additional layer of returns this week.

Gold Near All-Time High at $3,300/oz; Geopolitical Demand Sustains Rally


Gold continued its remarkable rally, trading near all-time highs driven by central bank buying, geopolitical uncertainty, and safe-haven demand from institutional investors. Central banks worldwide added over 1,000 tonnes to reserves in the past year.

For Indian investors, Sovereign Gold Bonds remain the most tax-efficient way to gain gold exposure, combining price appreciation with a 2.5% annual interest payment.

India Benefits as Global Supply Chains Diversify Away from China


India is emerging as a key beneficiary of the global supply chain realignment, with major technology and electronics manufacturers announcing significant investments in Indian manufacturing facilities. The Production Linked Incentive scheme is attracting commitments across smartphones, semiconductors, and specialty chemicals.

Never Miss an Edition

Every Sunday morning — market insights, editorial analysis, and wealth creation strategies. Free forever.

📢 Follow Our WhatsApp Channel
Integrato Times WhatsApp Channel QR Code
Scan QR code or click the button
to follow Integrato Times channel
OR
✉️ Get It Directly
📱
WhatsApp Broadcast List
+91 95991 81681 · Personal list
📧
Email Subscription
hello@integrato.in · Weekly edition
🌐
Visit integrato.in
Full wealth management services
📧 Email Subscription
WhatsApp Channel: https://whatsapp.com/channel/0029VaAMMCKJf05etfZkw91Y  ·  Published every Sunday  ·  Free forever  ·  AMFI MFD · IRDAI Licensed
💬 Reader Queries & Comments
Ask Sanjeev · Share Your View · Best Questions Featured Next Edition
📩 Ask a Question or Share Your View
✅ Thank you! Sanjeev will personally review your query. The best questions are featured in next Sunday's edition.
📧 All queries go directly to Sanjeev at hello@integrato.in · Replies within 48 hours · Your email is never shared publicly
🏆 Featured Q&A — From Readers Like You
Q: From Rajesh K., Greater Noida · Apr 2026
"Should I stop my SIP during a market correction or continue?"
Sanjeev: Never stop a SIP during correction — that is precisely when it works hardest for you. When the market falls 15%, your SIP buys 15% more units for the same rupees. Every unit bought at lower NAV adds to your long-term wealth. The only valid reason to stop a SIP is if you need that money for an emergency. Otherwise, stay the course. Corrections are not dangers — they are discounts.
Q: From Priya M., Noida · Apr 2026
"Term insurance vs ULIP — which is better?"
Sanjeev: These are two completely different products serving different purposes. Term insurance = pure life cover at minimal cost (₹1 crore cover for ₹12,000/year for a 30-year-old). ULIP = investment + insurance bundled — but with higher charges and lower returns. My advice: separate the two. Buy term insurance for protection. Invest separately in MFs for wealth creation. Keep insurance simple and keep investments transparent.
Your question could be next! Submit it using the form — the most insightful question each week gets a personal response from Sanjeev and is featured in the next Sunday edition. No question is too basic.

🔍 Product Spotlight
Weekly Deep-Dive · Understanding Financial Products
This Week's Product · 13 May 2026
Specialised Investment Funds (SIF) — India's Newest Asset Class
NEW IN 2025
What is a SIF?

Specialised Investment Funds are SEBI's newest regulated investment category, introduced in 2025, designed to sit between Mutual Funds (for retail investors) and Portfolio Management Services (for HNIs). The minimum investment threshold is ₹10 lakh — making it accessible to a wider range of serious investors.

SIFs can invest in a broader range of instruments than traditional mutual funds — including unlisted securities, special situation funds, long-short equity strategies, and complex debt instruments that were previously only available to AIF investors with ₹1 crore minimum tickets.

SIF vs MF vs PMS — Quick Comparison
Feature Mutual Fund SIF PMS
Min. Investment ₹500 SIP ₹10 Lakh ₹50 Lakh
Strategy Long only Long/short Long only
Unlisted Stocks No Yes No
SEBI Regulated Yes Yes Yes
✅ Suitable for
Investors with ₹10L+ idle capital · Portfolio looking for diversification beyond equities · Those who've maxed MF options · 3-5 year investment horizon
⚠️ Be aware of
Higher risk than traditional MFs · Less liquidity than open-ended funds · Complex strategies need understanding · Early redemption restrictions possible
🧠 Sanjeev's Take
SIFs fill a genuine gap. For investors who have exhausted MF options and find PMS minimum unaffordable, this is a legitimate step up. But it demands proper due diligence — talk to your advisor first.
Source: SEBI Circular dated March 2025 · SEBI (Specialised Investment Fund) Regulations · For educational purposes only. Not investment advice.
💼
Next Week
Flexi Cap Funds — The One Fund to Rule Them All?
📋
Week 3
NPS vs PPF vs ELSS — Retirement Savings Decoded
🏠
Week 4
REITs — Own Premium Real Estate for ₹300
⚡
Week 5
InvITs — Infrastructure Investment Trusts Explained
🧠 Did You Know?
Weekly Financial Intelligence Series · 13 May 2026
💡 This Week's Surprise Fact
"Rakesh Jhunjhunwala bought Titan at ₹3 per share in 2002. He held it through 4 crashes and a pandemic. By 2022 it hit ₹3,000. A ₹1 lakh investment became ₹10 crore in 20 years — a 29% CAGR."
This is not about being lucky. Rakesh studied the company's fundamentals, trusted the India consumption story, and — crucially — did not sell when everyone was panicking. He held Titan through the 2008 crash (−68%), the 2013 correction (−40%), and the 2020 COVID fall (−52%). Every time he held. That patience was worth ₹9.99 crore per ₹1 lakh invested.
Entry price
₹3
Peak value
₹3,000
Return
1000×
Holding period
20 years
The lesson for YOUR portfolio
1
The crash is not the problem — your reaction is. Titan fell 68% in 2008. Rakesh's paper loss was massive. He bought more. Most retail investors would have sold in panic. That decision to hold was worth crores.
2
India's consumption story is still at chapter 1. In 2002 Titan was considered a niche brand. By 2022 it was aspirational India's icon. Brands that ride India's rising middle class — this story is still unfolding. Your SIP is riding the same wave.
3
Time horizon is the only edge retail investors have. Mutual funds, FIIs, HNIs all compete on information. You cannot compete there. But you can out-hold them. Your 10-20 year SIP horizon is your moat.
Sanjeev's Take
"You don't need to find the next Titan. A simple Nifty 50 index SIP for 20 years will do more for your family's wealth than most 'smart' strategies will."
Source: NSE/BSE historical data · Titan Company Ltd filings · Biographical accounts of Rakesh Jhunjhunwala · For educational purposes only. Not a recommendation to invest in any specific stock.
😮 Surprise: The SIP Math Nobody Shows You
₹5,000/month for 30 years = ₹4.3 crore at 12% CAGR — but ₹3.9 crore of that is pure interest, not your money
Total investment: ₹18 lakh. Final corpus: ₹4.3 crore. ₹4.12 crore is compounding working for you — that is 95% of your wealth created by time, not effort.
Your money invested₹18 lakh (4.2%)
Compounding returns₹4.12 cr (95.8%)
Real-life proof: Infosys employees who invested their ESOP proceeds into index SIPs in 2000 are among India's wealthiest retail investors today — not because they timed markets, but because they kept investing for 25 years.
😱 Shocking: The ₹2 Crore Family Tragedy
A 38-year-old IT manager earning ₹18L/year died in 2023. His family received only ₹8 lakh in insurance — 5 months' salary
He had a ₹5 lakh employer group cover + ₹3 lakh endowment policy. His wife had a home loan EMI of ₹45,000/month. The ₹8 lakh lasted 6 months. The family sold their house.
What he should have had
₹18L × 20 = ₹3.6 crore term insurance at ₹28,000/year premium. That's ₹2,300/month — less than his Netflix + Swiggy combined. The family would have kept the house, maintained lifestyle, and had ₹3 crore to invest.
Source: IRDAI claim data 2023 · Composite case study based on verified real patterns · Names changed for privacy
🤯 Shocking: Two Neighbours, ₹47 Lakh Difference
Same salary. Same investment. Same 20 years. One paid ₹47 lakh more in tax than the other
Priya invested ₹10,000/month in a Growth plan MF for 20 years. Ravi invested the same in IDCW (dividend) plan. At 30% tax slab, Ravi paid tax on every dividend received. After 20 years, Priya had ₹47 lakh more — from the exact same investment.
Priya — Growth Plan
₹1.05 Cr
Tax paid: ₹0 until redemption
Ravi — IDCW Plan
₹58 Lakh
Tax paid annually: ₹47L total
The lesson: IDCW plans feel good (regular income!) but are a tax trap for high-slab investors. Switch to Growth plan unless you genuinely need the income.
📜 India Market History — Facts That Will Surprise You
2008 Crash
Sensex fell 61% in 12 months. Then rose 152% in the next 12 months
Investors who stayed invested from Jan 2008 to Jan 2010 actually made money. Those who sold at the bottom locked in permanent losses. The recovery was faster than any expert predicted.
COVID Crash 2020
Nifty fell 38% in 40 days. It recovered 100% in just 6 months
The fastest crash AND the fastest recovery in Nifty history. Investors who bought in March 2020 at the bottom doubled their money by October 2020. SIP investors who continued through the crash built enormous positions at cheap NAVs.
Sensex in 1979
Sensex started at 100 in 1979. It crossed 80,000 in 2024. That is 800× in 45 years
₹1 lakh invested in 1979 would be ₹8 crore today — without doing anything. No stock picking. No timing. Just holding the index. The Indian economy compounded at roughly 15% CAGR for 45 years despite wars, scams, recessions and pandemics.
The SIP Millionaire Formula
₹10,000/month SIP in Nifty 50 for 25 years creates ₹1 crore+ at historical average returns
Over 25 years, you invest ₹30 lakh and the market does the rest. At 12% CAGR your ₹30 lakh becomes ₹1.89 crore. At 15% (Nifty's actual 25-yr CAGR) it becomes ₹3.28 crore. Every Indian earning ₹50,000/month can retire wealthy with this one habit alone.
🏦
₹73+ Lakh Cr
India MF AUM
Apr 2026 · AMFI
📈
10.7 Crore
Active SIP Accounts
Apr 2026 · AMFI
💰
₹25,926 Cr
Monthly SIP Inflow
Apr 2026 · AMFI
🇮🇳
Only 3.8%
Indians in Stock Market
SEBI · 2026
⏳
800×
Sensex Since 1979
NSE Historical
📊 Market Intelligence Dashboard
Institutional-Grade · Weekly Briefing · 13 May 2026

⚡ 30-Second Market Summary

Week of 13 May 2026
Sensex
—
—
Nifty 50
—
▼ −0.02% (1D)
FII Net Flow
−₹5,740 Cr
YTD: −₹2,06,180 Cr
10Y G-Sec
6.93%
▼ from 7.02% (Wk Ago)

📈 Indices Performance

Source: BSE, NSE, Refinitiv · 11 May 2026
IndexLevel1D %1W %1Y %
Domestic Indices
BSE Sensex——+1.21−3.59
Nifty 50——+1.37−0.36
Nifty Midcap 10063,250+1.10+3.71+14.21
Nifty Smallcap 10019,280+0.87+3.82+13.87
Nifty 20014,310+0.24+2.09+3.92
Global Indices
Nasdaq Composite25,806−0.13+3.67+45.48
FTSE 10010,277−1.55−0.98+20.07
Hang Seng26,626+1.57+3.30+17.34
SSE Composite4,180+0.48+1.65+25.05
KOSPI7,490+1.43+13.51+191.01
Topix (Japan)3,840+3.00+3.04+42.44
✦ AI Interpretation

Midcap and Smallcap indices significantly outperforming large-caps (+14% vs −3.6% 1Y) signals a broadening market rally. This is characteristic of a maturing bull market. While the Sensex appears weak on a 1-year basis, mid-small cap strength suggests domestic investors are confident about India's earnings growth story. Implication: Flexi-cap and multi-cap funds are benefiting from both segments — a sound choice for current conditions.

📐 Valuation Snapshot

11 May 2026
PeriodSensex P/ENifty P/E
Current21.0721.16
1 Month Ago20.5120.32
1 Year Ago22.3921.99
PeriodSensex YieldNifty Yield
Current1.18%1.28%
1M Ago1.22%1.34%
💡 Valuation Insight

At P/E of 21x, Nifty is below its 5-year average of 23x — suggesting the market is at fair to slightly attractive valuations. Not a bubble. Not a bargain. A reasonable entry for long-term SIP investors.

🏛️ Institutional Flow Tracker — Equity

Source: NSDL, SEBI, NSE · 11 May 2026
Net Weekly Flow
FII
−₹5,740 Cr YTD: −₹2,06,180 Cr
DII
+₹441 Cr YTD: +₹3,10,067 Cr
MF
+₹1,817 Cr YTD: +₹1,89,488 Cr
Debt Flows
FII Debt
−₹465 Cr YTD: −₹4,110 Cr
MF Debt
−₹7,612 Cr YTD: −₹3,23,689 Cr
✦ AI Insight — Smart Money Positioning

FII are net sellers at −₹2.06 lakh crore YTD, yet markets have held ground — a testament to the power of domestic institutional and retail flows (DII YTD: +₹3.10 lakh crore). Smart money appears to be rotating away from large-cap Indian equities toward domestic consumption and mid-small cap segments. The sustained DII buying is a structural market support mechanism. For long-term investors, FII selling is an opportunity, not a warning.

💰 What This Means for Your Money
SIP Investor FII selling = market dips = lower NAVs = more units bought. This is compounding in action. Do not stop SIPs.
Trader Watch for trend reversal — if FIIs turn buyers, expect a sharp rally. Track daily F&O data for signals.
Long-term Investor DII absorbing FII sales is bullish long-term. Domestic savings are becoming market support.
Risk Alert Continued FII selling + global risk-off could pressure mid-small caps despite strong fundamentals.

🔍 What Moved the Market This Week?

Bloomberg-style Briefing · Week of 13 May 2026
01

PMI Manufacturing Surges to 59.1 — Decade High

India's April manufacturing PMI hit 59.1, the highest in over 10 years. New orders, output, and employment all expanded sharply, confirming broad-based economic acceleration rather than sector-specific strength.

Bullish for Equities Bullish: Industrials, FMCG, Infra
02

US-Iran Ceasefire Talks — Crude Oil Falls to $97.50

Optimism around a potential US-Iran deal sent Nymex crude down 7.4% in a week to $97.50/bbl. For India, which imports 85% of its crude requirements, this is significant fiscal relief — lower import bill, lower inflation pressure.

Bullish: India Macro Watch: ONGC, Oil Marketing
03

10-Year G-Sec Yield Eases to 6.93% — Bond Market Rally

The benchmark 10-year government security yield fell from 7.05% (month ago) to 6.93%, reflecting lower inflation expectations and anticipation of future RBI rate cuts. This is positive for bond funds and rate-sensitive sectors.

Bullish: Banking, NBFCs, Debt Funds Neutral: Equity large-caps
04

FII Net Selling Continues — ₹5,740 Cr Outflow in Week

Foreign institutions continue selling Indian equities despite improving fundamentals. The dollar's strength and higher US yields are pulling capital back to developed markets. DII and SIP flows are fully absorbing the selling pressure.

Bearish: Large-cap IT, BFSI Domestic Flows: Counterbalancing
05

Midcap/Smallcap Outperformance — Broad Rally Signals

Midcap 100 gained 3.71% and Smallcap 100 gained 3.82% in the week — significantly outperforming large-caps (Nifty +1.37%). This breadth expansion is a healthy sign, though it also warrants valuation caution in specific pockets.

Bullish: Mid/Small Cap MFs Watch: Overvalued individual stocks

💱 Currency Market

FBIL · 11 May 2026
Currency PairCurrent1M Ago1Y Ago
USD / INR₹94.78₹92.96₹84.57
EUR / INR₹111.35₹107.26₹96.13
GBP / INR₹128.85₹123.08₹112.97
JPY / INR (100¥)₹60.61₹58.18₹59.13
✦ AI Currency Insight

Rupee has weakened 12% vs USD in 1 year (84.57→94.78). For investors: international MF NAVs benefit from INR weakness. For importers and foreign education planners: budget for higher costs. RBI likely managing depreciation to protect exports.

🛢️ Commodity Prices

Refinitiv · 11 May 2026
CommodityPrice1W %1Y %
Nymex Crude$97.50/bbl−7.41+68.31
Brent Crude$103.17/bbl−9.56+69.27
Gold (USD/oz)$4,685.18+1.38+39.26
Gold (₹/10g)₹1,50,680+0.60+55.03
Silver (₹/kg)₹2,54,973+6.31+167.02
✦ AI Commodity Insight

Silver up 167% in 1 year is extraordinary — driven by industrial demand (EVs, solar panels) + investment demand. Gold up 55% reinforces the case for 5-8% portfolio allocation. Falling crude = India macro positive.

🏦 Policy Rates & Macro Indicators

RBI · Refinitiv · May 2026
Policy RateCurrent3M Ago1Y Ago
Repo Rate5.25%5.25%6.00%
Reverse Repo3.35%3.35%3.35%
CRR3.00%3.00%4.00%
SLR18.00%18.00%18.00%
IndicatorLatestPrevious
CPI Inflation3.40% (Mar'26)3.21% (Feb'26)
WPI Inflation3.88% (Mar'26)2.13% (Feb'26)
IIP Growth4.10% (Mar'26)5.10% (Feb'26)
GDP Growth7.80% (Q3 FY27)8.40% (Q2 FY27)
Fiscal Deficit4.3% (FY27)4.4% (FY27)
✦ AI Macro Insight

CPI at 3.4% — well within RBI's 4% target. GDP at 7.8% — robust growth. Repo cut from 6% to 5.25% in 1 year signals an easing cycle. Expectation: 1-2 more cuts in FY27, beneficial for bonds and rate-sensitive equities.

📋 Bond & Debt Market Intelligence

Source: CCIL · Refinitiv · 11 May 2026
Debt Watch (in %)
Instrument7 MayWk AgoMth AgoYr Ago
Call Rate5.185.295.085.83
Tri-Party Repo5.085.254.885.75
91 Day T-Bill5.285.285.255.87
364 Day T-Bill5.665.525.645.84
5 Yr Corp Bond7.367.507.617.02
10 Yr G-Sec6.937.027.056.34
G-Sec & Corp Bond Yields (%)
TenorG-SecAAA CorpAA Corp
1 Year5.837.487.78
2 Year6.207.487.87
3 Year6.407.377.86
5 Year6.637.367.86
10 Year6.937.697.52
📈 G-Sec Yield Curve — May 2026
5.83
1Y
6.20
2Y
6.40
3Y
6.63
5Y
6.93
10Y
Upward slope = healthy economy Normal curve ✓
✦ AI Bond Intelligence

The yield curve is positively sloped (5.83% → 6.93%) — a normal, healthy shape indicating economic growth expectations. The 10Y yield has fallen from 7.05% to 6.93% in a month, signalling the bond market is pricing in RBI rate cuts. What this means: Long-duration and Gilt funds are poised to deliver superior returns as yields fall. The spread between G-Sec (6.93%) and AAA Corp (7.69%) of 76bps suggests corporate bonds offer reasonable risk-adjusted premium. Short-duration debt funds (6-12 month horizon) currently offer the best risk-reward for conservative investors.

💼 Mutual Fund Category Performance

Source: MFI 360 Explorer · CAGR returns
Equity Categories (CAGR %)
Category1Y3Y5Y7Y
Large Cap2.2913.4411.8112.53
Large & Mid Cap8.2218.1715.7116.12
Flexi Cap5.8415.6913.5214.27
Multi Cap9.5818.9916.3017.43
Mid Cap13.6622.2118.4419.47
Small Cap15.3820.4919.2821.13
Debt Categories (CAGR %)
Category3M6M1Y3Y
Liquid6.526.186.126.82
Ultra Short6.225.585.956.67
Short Duration4.173.434.826.72
Credit Risk9.547.977.738.74
Corp Bond4.073.164.656.86
Gilt3.941.35−0.415.55
Hybrid Categories (CAGR %)
Category1Y3Y5Y7Y
Aggressive Hybrid4.9213.6211.9912.60
Conservative Hybrid3.358.137.627.70
Dynamic Asset Alloc.3.8511.209.3810.04
💡 Who Should Consider What Now?

Aggressive / Long horizon (7Y+): Small & Mid Cap — highest compounding

Moderate (5Y): Flexi Cap / Multi Cap — best risk-adjusted

Conservative / Income: Credit Risk funds offering 9.54% (3M)

Capital preservation: Liquid / Ultra Short for parking funds

✦ AI Fund Intelligence

The performance divergence is striking: Small Cap at 15.38% (1Y) vs Large Cap at 2.29% confirms the breadth rally thesis. However, 7-year returns show Small Cap (21.13%) vs Large Cap (12.53%) — a 8.6% annualised gap that compounded over decades is the difference between ordinary and extraordinary wealth creation. In debt, Gilt funds showing negative 1-year returns (−0.41%) are a timing opportunity — as the RBI cuts rates, Gilt NAVs will rise significantly. Patient debt investors should consider adding Gilt exposure now.

📅 Event Calendar — Next 15 Days

Domestic & Global · May 2026
🇮🇳 Domestic Events
08 MayForex Reserves & Credit Growth DataRBI
08 MayDeposit Growth & Bank Advances DataRBI
14 MayCPI Inflation — April 2026MACRO
15 MayWPI Inflation — April 2026MACRO
16 MayIIP Data — March 2026MACRO
🌐 Global Events
08 MayUS Average Earnings (April 2026)GLOBAL
08 MayJapan Services PMI — April 2026GLOBAL
09 MayGermany Industrial Output (March 2026)GLOBAL
13 MayUS CPI Inflation — April 2026FED WATCH
21 MayFOMC Meeting Minutes ReleaseFED WATCH

✅ Investor Action Checklist — This Week

Integrato Research · 11 May 2026
📈
For Equity Investors

Review your SIP allocation — if mid/small cap exposure is below 20% of equity portfolio and horizon is 7Y+, consider increasing. Use the underperformance of large-caps as rebalancing signal, not panic.

💰
For SIP Investors

April was the 45th consecutive month of SIP growth. Stay invested. If you paused SIPs during the correction, restart immediately — you have been missing compounding at lower NAVs.

📋
For Traders

Nifty at 23,413. Key support: 23,000. Resistance: 24,200. FII selling — watch for reversal signal. Bank Nifty showing strength. Watch inflation data on 14 May for directional cue.

🏦
For Debt/Conservative Investors

10Y G-Sec at 6.93% and falling. Consider adding Gilt fund or long-duration exposure (10-15% of debt portfolio). Credit Risk funds at 9.54% (3M) for those with 2-3 year horizon.

⚠️
Risk Alerts to Watch

FII YTD outflow at −₹2.06 lakh crore. US-Iran situation could reverse crude gains suddenly. Rupee at 94.78 — weakening trend; review foreign education/travel plans. Global markets mixed.

📅
Portfolio Review Reminders

Review nominees on all policies and MF folios. Step up SIP by 10% if not done in April. Check if your term insurance cover = 15× annual income. File ITR by July 31st — start gathering documents now.

📚 Past Editions
Past editions will appear here after the first Sunday publication.
IT
Nifty IT
+2.14%
📊 Key Stocks in This Sector
StockCompany Price (₹)1D %1W %Mkt Cap
✦ Investor Intelligence — What This Move Means
CIN: U74140UP2021PTC149502  |  GSTIN: 09AAGCI2359R1ZT  |  ARN: 173155  |  IRDAI Lic.: F1047480